Коли VPS починає працювати повільно, справжньою причиною майже завжди є одне з чотирьох вузьких місць: процесор, оперативна пам’ять, введення-виведення на диск або мережа. У цьому посібнику описано послідовність дій, яка дозволяє швидко виявити вузьке місце за допомогою htop, iostat, а також atop (а також кілька швидких команд для «перевірки працездатності»).
Для робочих навантажень у виробничому середовищі стабільний моніторинг починається з передбачуваних ресурсів. Оберіть надійний VPS на базі Linux з достатньою потужністю процесора та оперативної пам’яті, а також швидким сховищем, щоб ваші сервіси та засоби діагностики залишалися чуйними під навантаженням.
Відкрийте термінал (macOS/Linux) або SSH-клієнт (Windows Terminal / PuTTY) і підключіться до сервера. Замініть username та SERVER_IP своїми значеннями.
ssh username@SERVER_IPЯкщо ви використовуєте власний порт SSH (наприклад: 2222):
ssh -p 2222 username@SERVER_IPУсі наведені нижче команди виконуються в межах цієї сесії SSH.
Перш ніж відкривати повноекранні інструменти, виконайте кілька швидких команд. Вони допоможуть вам зрозуміти, чи проблема полягає в навантаженні на процесор, пам’яті, переповненні диска чи в чомусь очевидному, як-от заповнена файлова система.
uptime
free -h
df -h
ps aux --sort=-%cpu | head -n 10
ps aux --sort=-%mem | head -n 10
Як швидко інтерпретувати:
uptime: перевірте середнє навантаження (за 1/5/15 хвилин). Якщо навантаження постійно значно перевищує кількість віртуальних процесорів, система перевантажена.free -h: якщо оперативної пам’яті не вистачає і активно використовується своп, затримки та «зависання» є звичайним явищем.df -h: якщо файлова система заповнена на 100%, багато служб працюють з перебоями (бази даних, журнали, завантаження).Debian/Ubuntu:
sudo apt update && sudo apt install -y htopCentOS / RHEL / AlmaLinux / Rocky (для деяких систем може знадобитися попередня інсталяція EPEL):
sudo dnf install -y htop || sudo yum install -y htophtop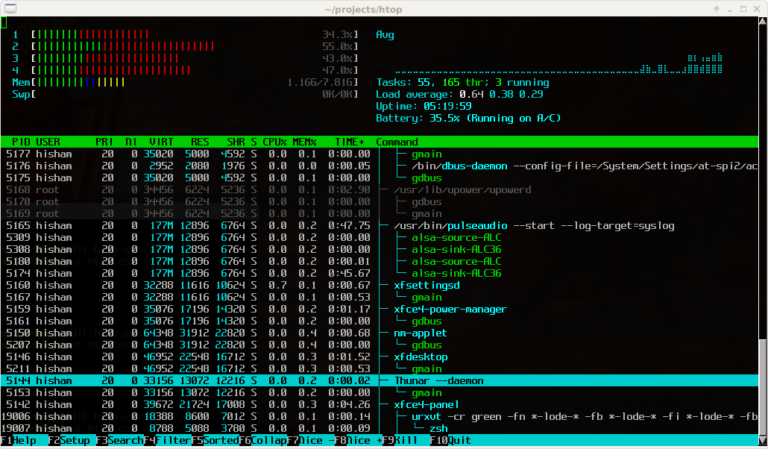
%CPU або %MEM , щоб визначити найбільших споживачів.%CPU , щоб знайти процеси, що сильно навантажують процесор.%MEM , щоб знайти споживачів пам’яті.iostat.q.Якщо показники процесора та пам’яті виглядають нормально, але сервер все одно працює повільно, дуже поширеним прихованим вузьким місцем є дисковий ввід-вивід (записи в базу даних, журнали, резервні копії, перевантажене сховище).
Debian/Ubuntu:
sudo apt update && sudo apt install -y sysstatCentOS / RHEL / AlmaLinux / Rocky:
sudo dnf install -y sysstat || sudo yum install -y sysstatiostat -x 5 3Параметри:
-x — розширена статистика5 — інтервал (секунди)3 — кількість звітів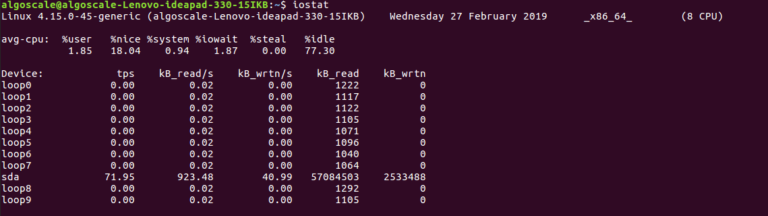
await: середній час очікування запитів на введення-виведення. Великі значення (десятки/сотні мілісекунд) під час навантаження часто означають перевантаження сховища.%util: відсоток часу зайнятості диска. Якщо він залишається на рівні 80–100%, диск є вузьким місцем.r/s, w/s, rkB/s, wkB/s: скільки операцій і пропускної здатності ви використовуєте.Порада від професіонала: якщо ви підозрюєте, що «один процес перевантажує диск», додайте iotop до свого набору інструментів:
sudo apt install -y iotop || sudo dnf install -y iotop
sudo iotop -oPaatop — це чудовий інструмент, коли вам потрібна повна картина в одному інтерфейсі: ЦП, ОЗУ, диск і мережа, а також використання ресурсів кожним процесом.
Debian/Ubuntu:
sudo apt update && sudo apt install -y atopCentOS / RHEL / AlmaLinux / Rocky (часто через EPEL):
sudo dnf install -y atop || sudo yum install -y atopsudo atop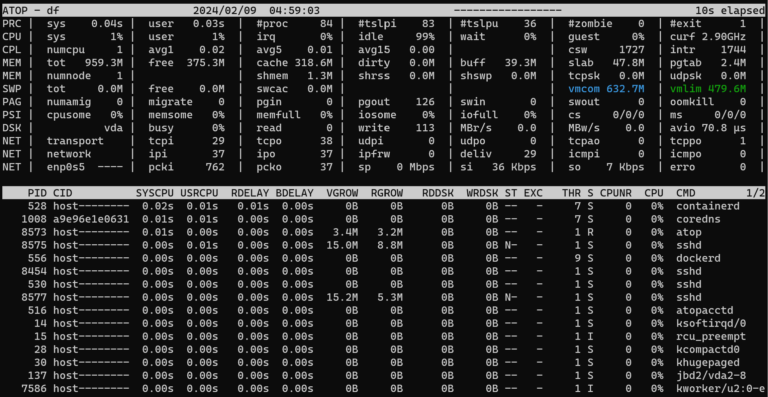
iostat.Вийдіть з atop за допомогою q.
Іноді «повільність» не пов’язана з навантаженням — це перенавантаження мережі, занадто багато з’єднань або служба, що застрягла через перевищення часу очікування. Ці команди допомагають перевірити стан мережі.
ss -s
ss -tulpn | head
ip -s link
ping -c 5 1.1.1.1
Якщо вам потрібен огляд пропускної здатності в режимі реального часу:
sudo apt install -y nload || sudo dnf install -y nload
nload
Порада: Дуже поширеною «прихованою» проблемою є раптовий сплеск підключень (боти, скрейпінг, брут-форс). Якщо ви бачите ненормальну кількість підключень, розгляньте можливість обмеження швидкості та посилення безпеки.
Щоб зробити моніторинг навантаження Linux VPS відтворюваним, збережіть простий скрипт, який збирає ключові показники (CPU/пам’ять, топ-процеси, знімок дискового вводу-виводу, використання файлової системи та підсумок підключень).
sudo nano /usr/local/sbin/vps-healthcheck.shВставте скрипт нижче:
#!/usr/bin/env bash
set -euo pipefail

echo "=== TIME ==="
date
echo

echo "=== UPTIME / LOAD ==="
uptime
echo

echo "=== CPU / TOP PROCESSES ==="
ps aux --sort=-%cpu | head -n 10
echo

echo "=== MEMORY ==="
free -h
echo

echo "=== TOP MEMORY PROCESSES ==="
ps aux --sort=-%mem | head -n 10
echo

echo "=== DISK USAGE ==="
df -h
echo

echo "=== DISK I/O (iostat snapshot) ==="
if command -v iostat >/dev/null 2>&1; then
  iostat -x 1 2
else
  echo "iostat not installed (install sysstat)."
fi
echo

echo "=== CONNECTION SUMMARY ==="
ss -s || true
echo

echo "=== LISTENING PORTS (top) ==="
ss -tulpn 2>/dev/null | head -n 20 || true
echo
Зробіть його виконуваним і запустіть:
sudo chmod  x /usr/local/sbin/vps-healthcheck.sh
sudo /usr/local/sbin/vps-healthcheck.shЯкщо моніторинг показує, що CPU, RAM або дисковий ввід-вивід більшу частину часу наближаються до межі, часто надійніше масштабувати ресурси, ніж постійно боротися з симптомами. Більш потужний VPS на базі Linux із швидшим сховищем та більшим запасом потужності може усунути вузькі місця, зменшити затримку та забезпечити стабільність ваших послуг під час пікового трафіку.
Моніторинг навантаження Linux VPS стає простим, якщо дотримуватися послідовного алгоритму: htop для процесора/оперативної пам’яті, iostat для дискового вводу-виводу та atop для загального огляду. Збирайте показники під час реального навантаження, визначайте вузькі місця, а потім вирішуйте, чи слід оптимізувати додаток/базу даних або оновити ресурси VPS.